Ag Climate Dashboard: Recent

Daily Temperature Maps
| Maximum Temperature | Minimum Temperature |
|---|---|

|

|
|
|
|
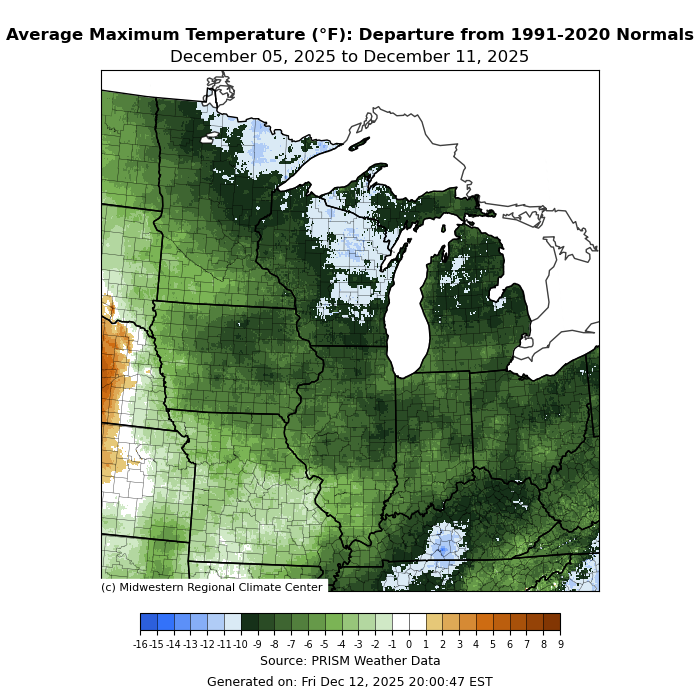
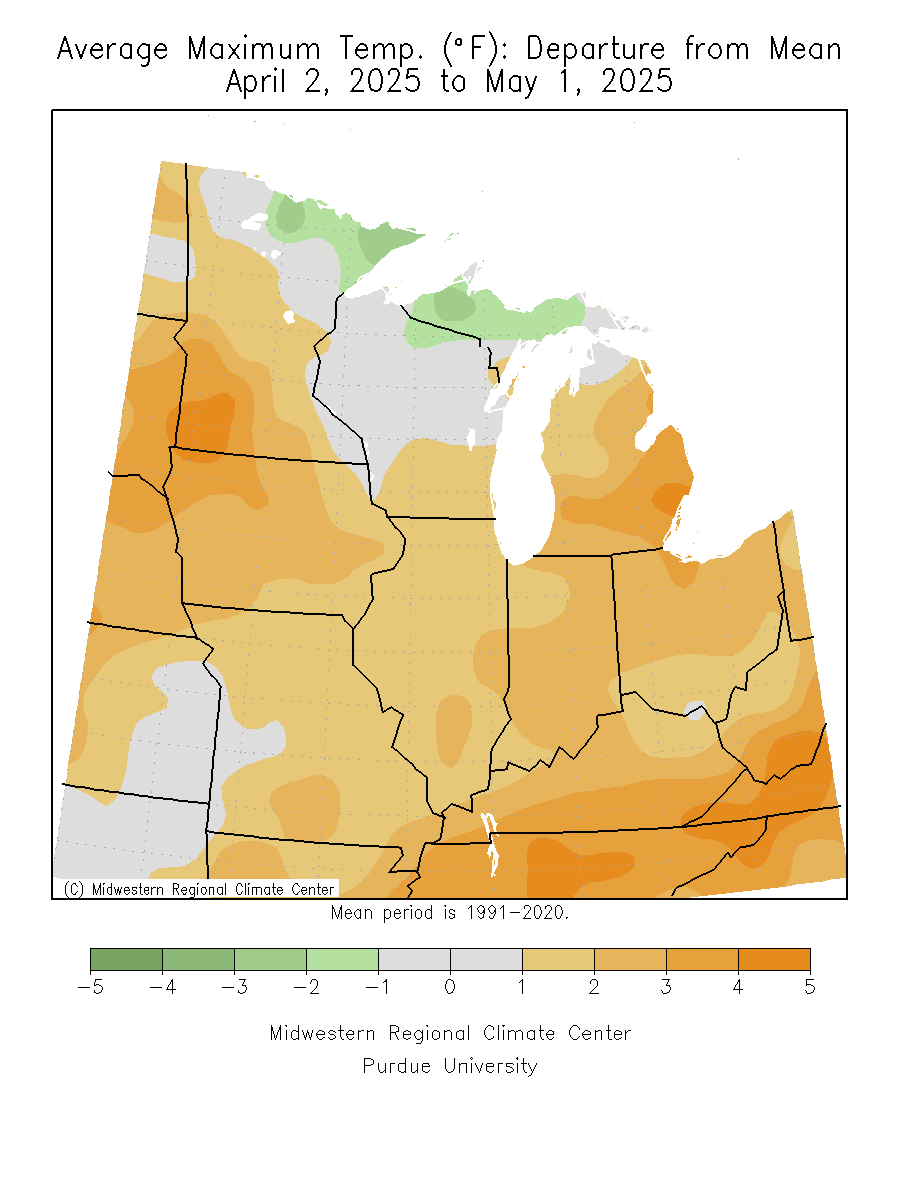
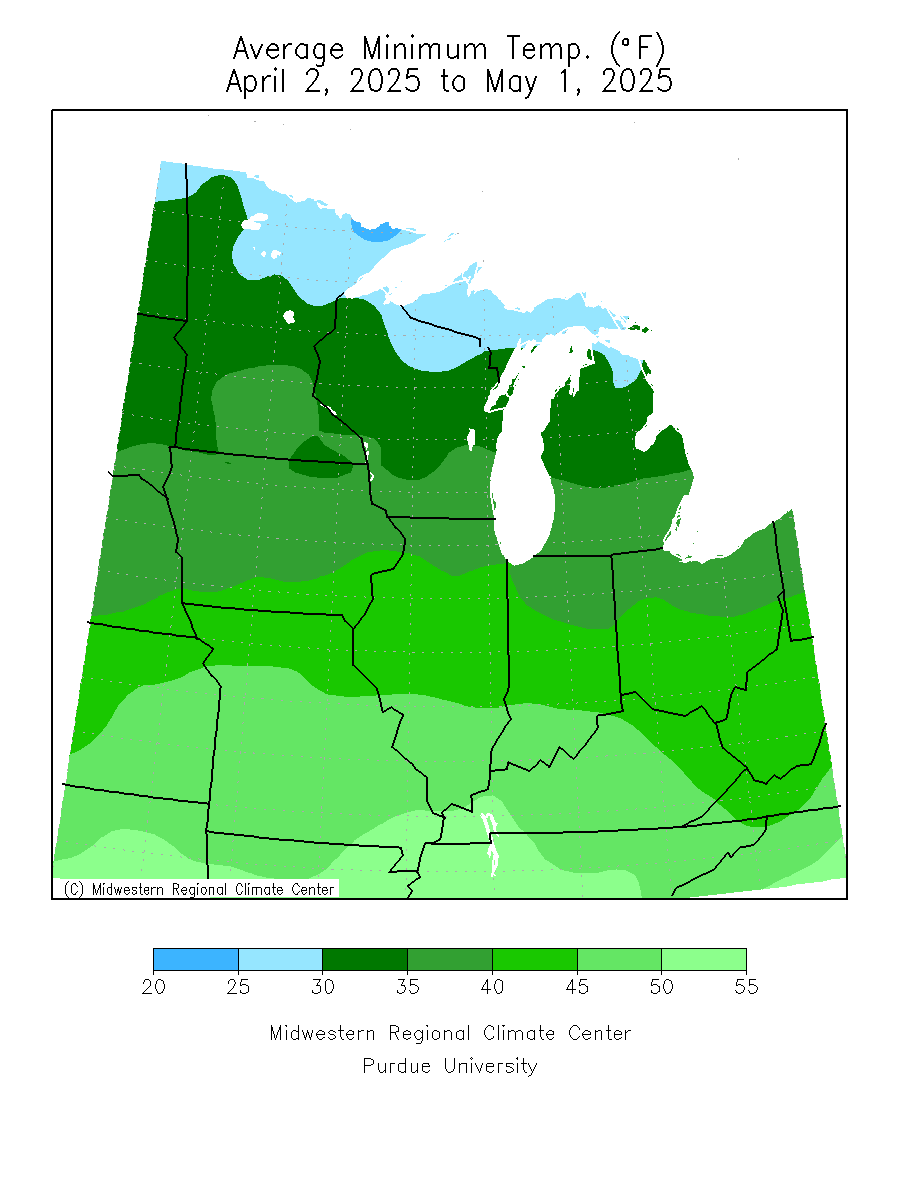
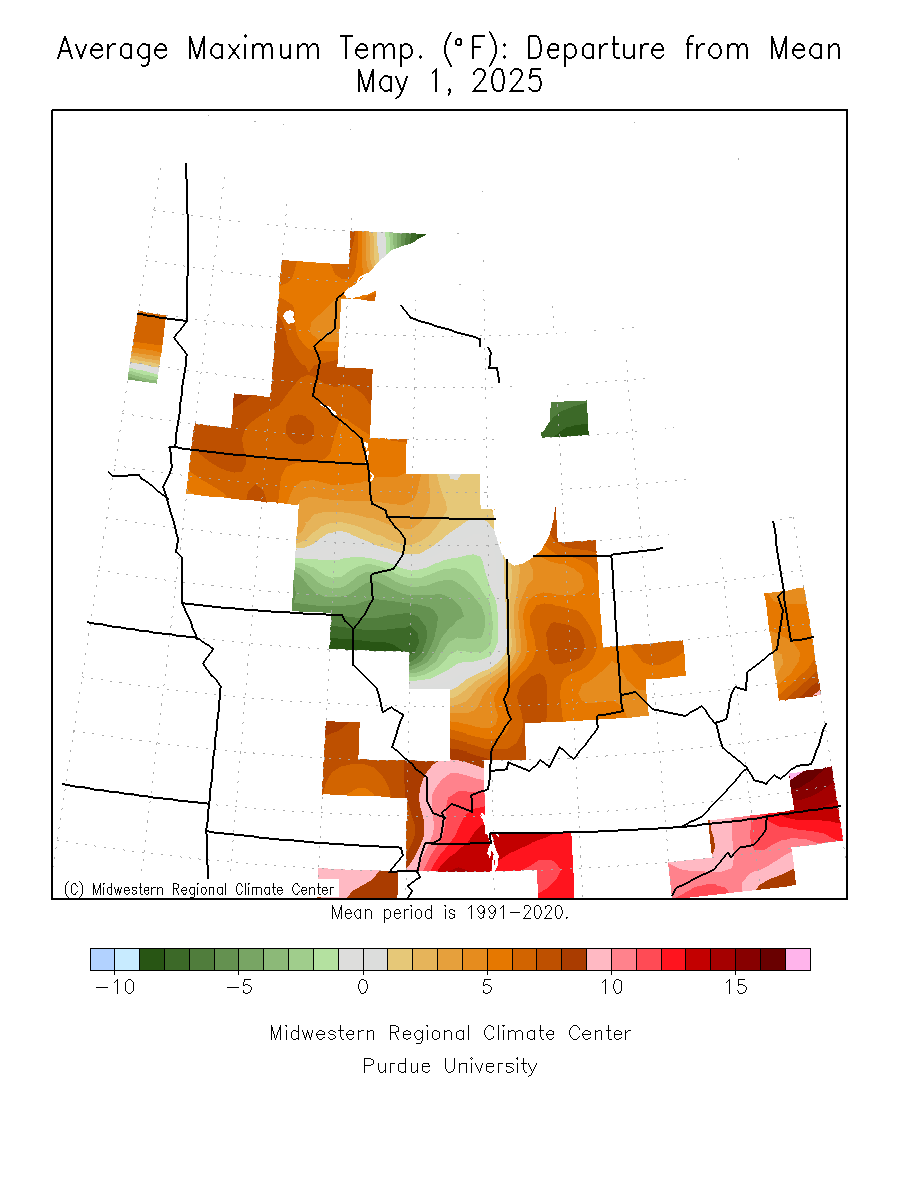
Average Temperature Maps
| Time Period | Avg Temp (°F) |
Avg Temp Departure |
Max Temp (°F) |
Max Temp Departure |
Min Temp (°F) |
Min Temp Departure |
|---|---|---|---|---|---|---|
| Last 7 Days |

|

|

|
|

|

|
| Last 30 Days |

|

|

|
|
|

|
| Month to Date |

|

|

|
|

|

|
| Recent Month Select | ||||||
| Recent Season Select | ||||||
Freeze Maps
| Date of Last 28°F Spring Freeze | Date of Last 32°F Spring Freeze |
|---|---|
.")
|
.")
|
| Date of First 28°F Fall Freeze | Date of First 32°F Fall Freeze |
|---|---|
.")
|
.")
|
Daily Precipitation Maps
| Station Precipitation | Multi-sensor Precipitation |
|---|---|

|

|
|
|
|
Accumulated Precipitation Maps
| Time Period | Precipitation (inches) |
Precipitation Percent of Mean (inches) |
Multi-Sensor Precipitation (inches)) |
|---|---|---|---|
| Last 7 Days |

|

|

|
| Last 30 Days |

|

|

|
| Month to Date |

|

|

|
| Recent Month Select | |||
| Recent Season Select | |||
Days without Precipitation Maps
| Recent Days without Precipitation Map | Days without Precipitation: Archive |
|---|---|
|
|
|
|
|
|
Soil Temperature Maps
24-Hour Period
-
2-inch Under Bare Soil

-
4-inch Under Bare Soil


7-Day Period
-
2-inch Under Bare Soil

-
4-inch Under Bare Soil


Visit Regional Mesonet Program Archive for older maps.

Potential ET (PET) Maps
| 24-hr PET Map | 7-day PET Map |
|---|---|

|

|
Visit Regional Mesonet Program Archive for older maps.
PET & Water Balance Maps
|
Potential Evapotranspiration (PET) Observed and forecast PET maps. |
Precipitation Minus PET (Water Balance) Observed and forecast water balance maps. |
|---|---|

|

|
|
|
|
Click each map to open the full image in a new browser tab.


MGDD Maps (Modified Growing Degree Days)
Start Date: April 1


Stress Degree Days


USDA Commodities in Drought
Corn Areas in Drought (Latest Map)
Soybeans Areas in Drought (Latest Map)

Crop Progress Maps and Reports
View weekly crop progress and condition maps from USDA NASS
This resource provides access to weekly maps and data on U.S. crop progress and conditions, generated from the USDA National Agricultural Statistics Service (NASS) Crop Progress Reports.
- Facilitates monitoring of planting, development, and harvest stages
- Links to download original NASS data for custom analysis
USDA NASS Statistics by State
Access state-level agricultural statistics and reports from NASS
The USDA National Agricultural Statistics Service (NASS) Statistics by State portal provides comprehensive access to agricultural data for every U.S. state, including crop, livestock, and economic statistics, as well as historical publications and geospatial data.
- Quick Stats searchable database for customized queries by commodity, location, and time period
- State and county-level statistics, interactive maps, and geospatial data
- Latest news releases and updates on agricultural production and surveys
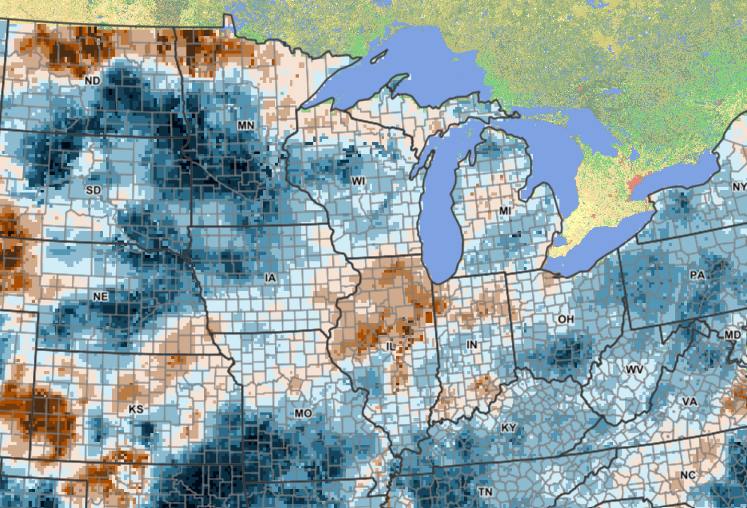
Crop CASMA
(Crop Condition and Soil Moisture Analytics)
Monitor crop condition and soil moisture using NASA satellite data
Crop CASMA is a web-based geospatial application developed by USDA-NASS, NASA, and George Mason University. It provides high-resolution data on soil moisture and vegetation conditions, supporting agricultural monitoring, research, and informed decision-making.
- View and analyze current soil moisture and crop vegetation conditions nationwide
- Supports crop planting, yield forecasting, drought and flood monitoring, and research on sustainability