March 2026
March 2026 Overview – Midwestern Regional Climate Center
Temperature
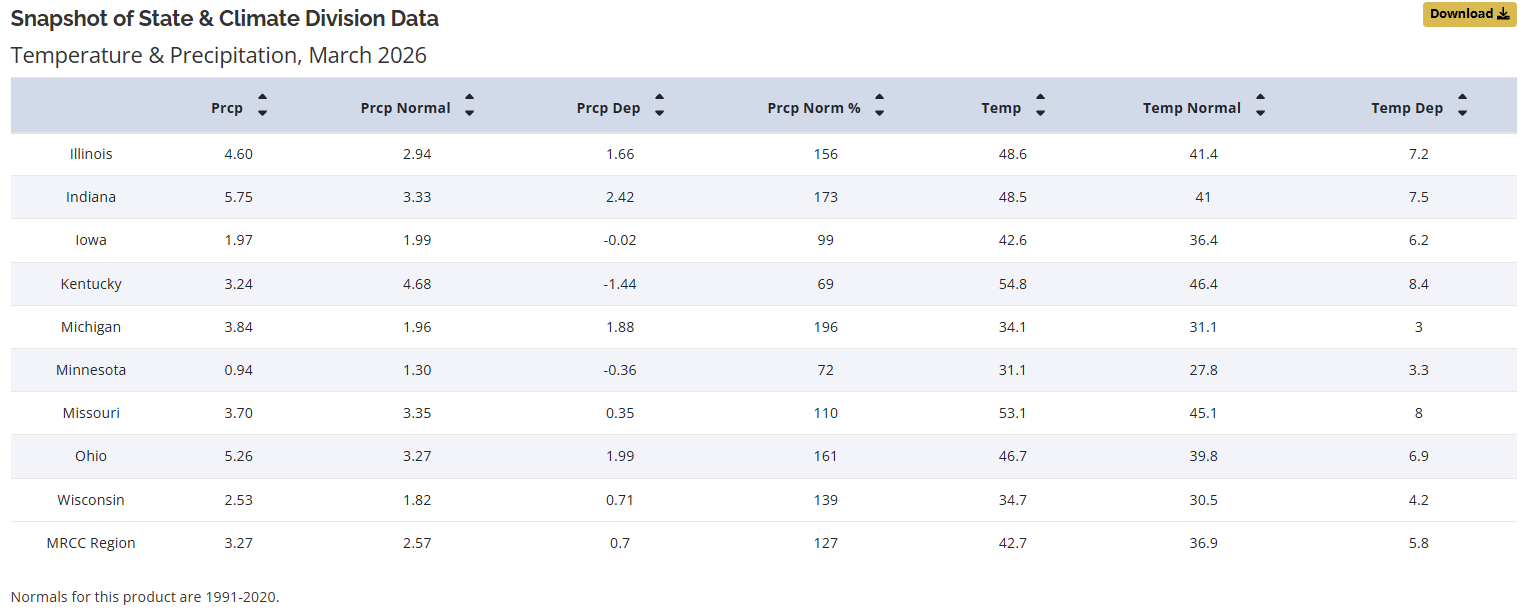
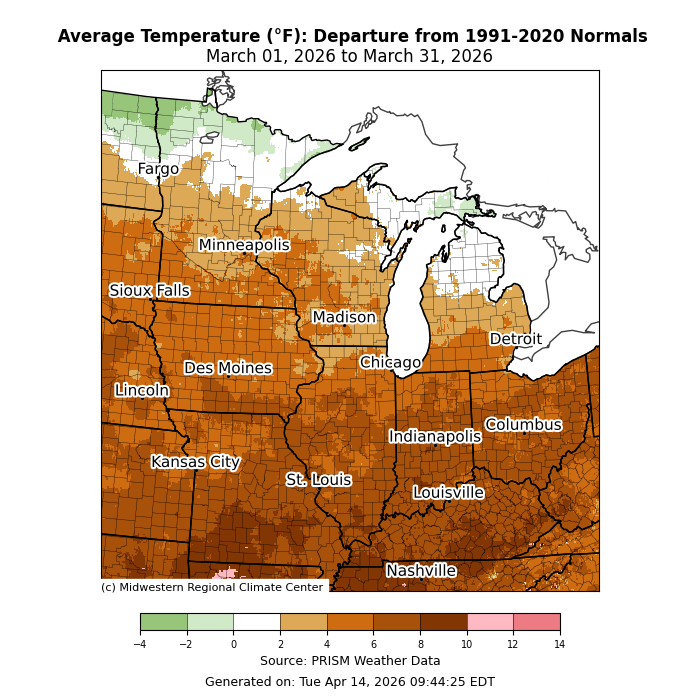
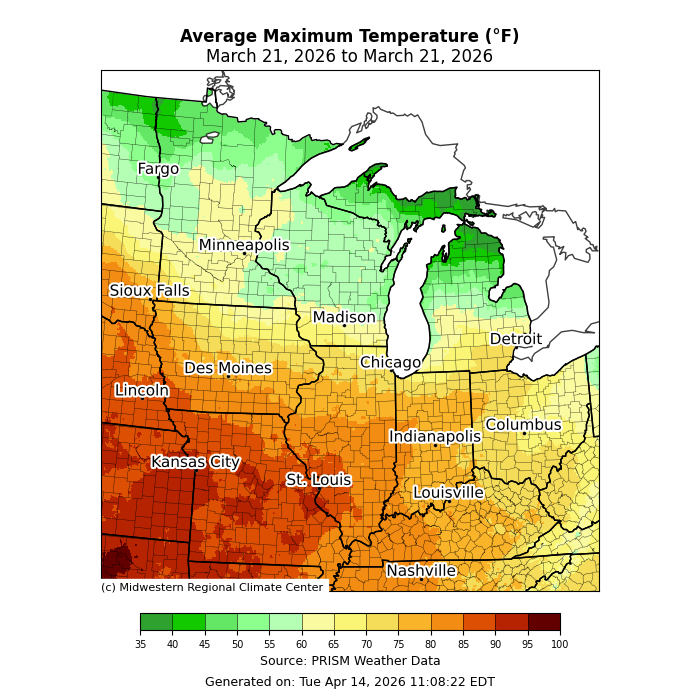
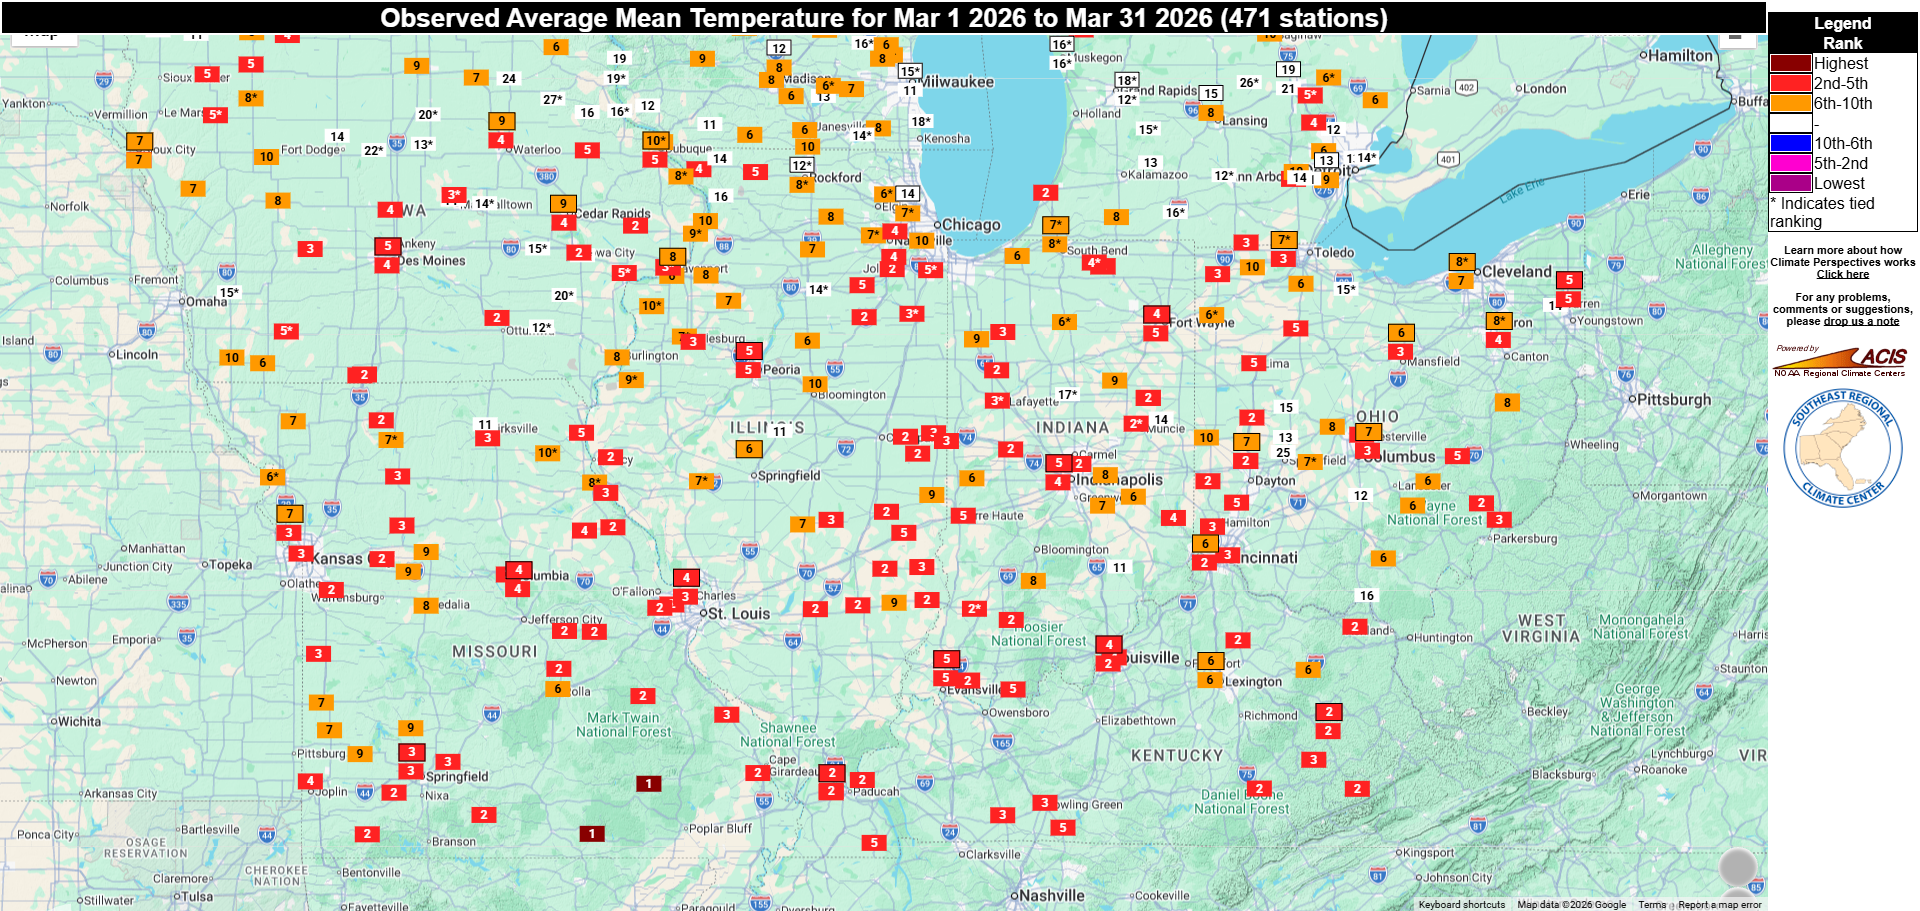
The average March temperature for the Midwest was 42.7°F, which was 5.8°F above the 1991-2020 normal (Figure 1). Temperatures ranged from near normal across the far north, warming to 6 to 10°F above normal across the south (Figure 2). Statewide average temperatures ranged from 3.0°F above normal in Michigan to 8.4°F above normal in Kentucky. Final rankings indicate that the Midwest had its 8th warmest March on record, with 6 states ranked among the top 10 warmest (Kentucky-4th, Missouri-4th, Illinois-5th, Indiana-6th, Iowa-Tied 6th, Ohio-7th). Persistent warmth was a dominant feature across most of the region throughout March, except for a few days mid-month when temperatures were well below normal. High temperatures across the central and lower Midwest surged into the 70s and 80s around March 10-11, accompanied by unseasonable humidity. On March 11, dew point temperatures reached the mid-60s across Missouri, central Illinois, central Indiana, Ohio, and Kentucky. Around March 21, a record-setting heat dome that had been building across the western U.S. crept eastward, briefly surging temperatures to over 90°F in Iowa and Missouri (Figure 3). On March 21, Sioux City, Iowa, had its warmest March day on record and its earliest 95°F day on record, dating back to 1896. The previous record was set on April 15, 2002. On March 22, St. Louis, Missouri, had its 2nd-earliest 90°F day on record in 151 years of recordkeeping. On March 26, Springfield, Illinois, had its 2nd-earliest 90°F day on record, with 146 years of observations. Columbia, Missouri, had a record-setting 10 days in March with maximum temperatures at or above 80°F. Cincinnati, Ohio, had 13 days with maximum temperatures at or above 70°F, the most on record for March in the past 152 years. Most long-running weather stations across the lower half of the Midwest had a top 10 warmest March (Figure 4).
Precipitation
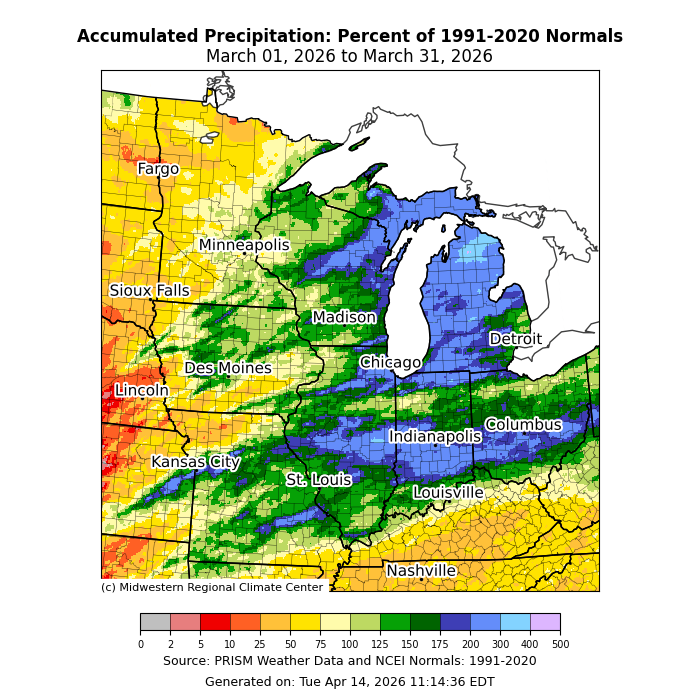
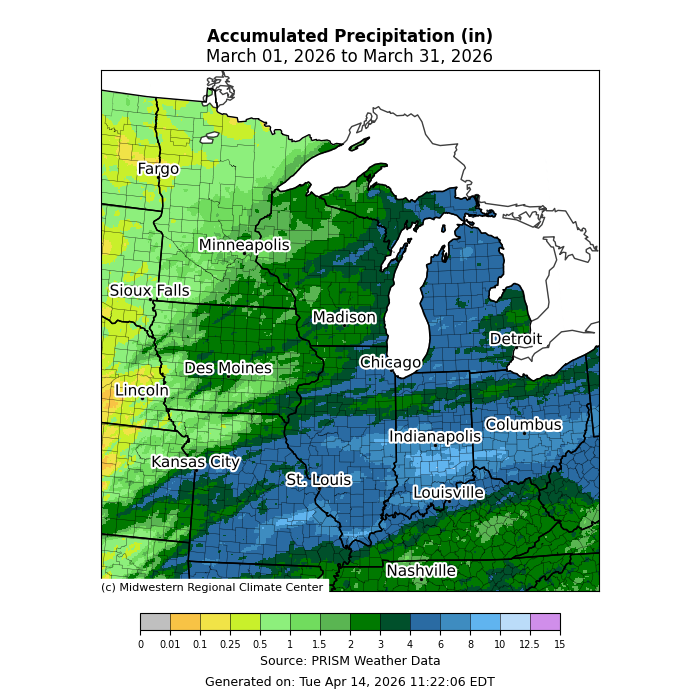
March precipitation totaled 3.27 inches for the Midwest, which was 0.7 inches above normal, or 127 percent of normal (Figure 1). Precipitation was above normal for much of the region, with notable wetness (200 to 300 percent of normal) across Michigan, northeast Wisconsin, central and northern Illinois, central and northern Indiana, and the southern half of Ohio (Figure 5). Conversely, precipitation was 25 to 70 percent of normal throughout Kentucky, the western half of Minnesota, and along the Missouri-Iowa border. Statewide precipitation totals ranged from 1.44 inches below normal in Kentucky to 2.42 inches above normal in Indiana. Final rankings indicate that Michigan had its 3rd-wettest March on record, and Indiana and Ohio had their 13th-wettest. A very active weather pattern brought consecutive storm systems through the Midwest in March. Across the southern half of Indiana and into southern Ohio, monthly precipitation totals ranged from 7 to 10 inches (Figure 6). Columbus, Indiana, and Cincinnati, Ohio, both had 4 days in March with at least 1 inch of rainfall, which tied the monthly record. In northern Michigan, several long-running observation sites (with over 100 years of data) recorded their wettest March on record, including Petoskey, Lake City, West Branch, and East Tawas. In northwest Ohio, Bowling Green had its wettest March in 131 years, and Toledo had its 3rd wettest in 154 years.
Snowfall
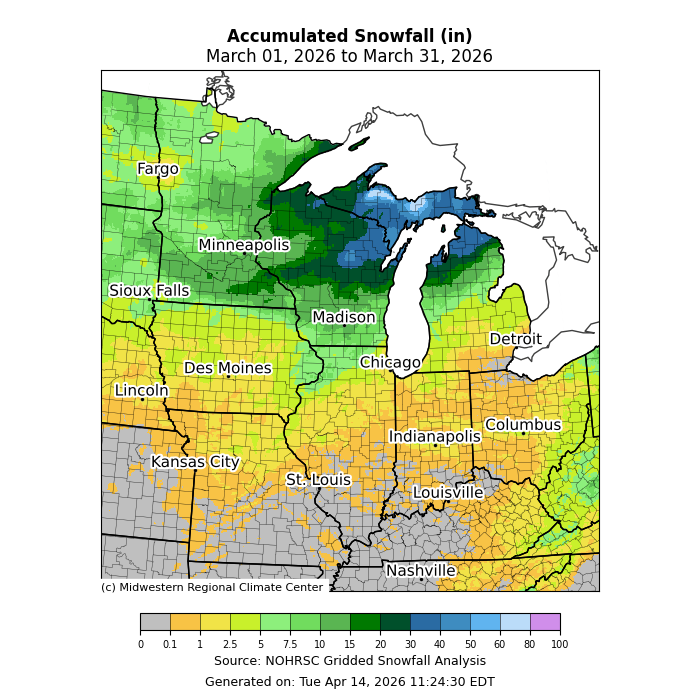
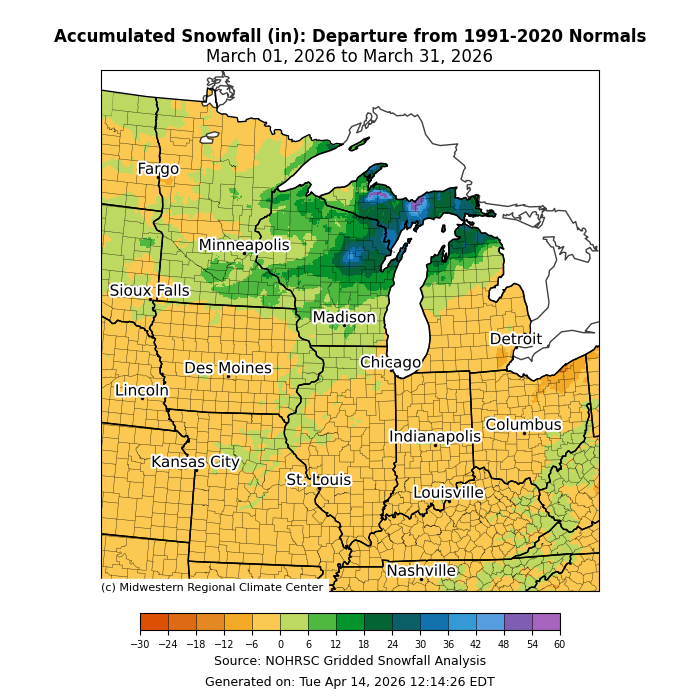
March snowfall totals were above average across Wisconsin, northern Michigan, and much of Minnesota. Across Michigan’s Upper Peninsula, snowfall totals ranged from 20 to 80 inches for the month (Figure 7), which was about 10 to 50 inches above normal (Figure 8). Herman, Michigan, set a new one-day snowfall record for March—and possibly a new statewide all-time single day record—when 34 inches was measured on March 16, 2026. Herman also had its second snowiest March on record, with 77.5 inches. Incredibly, about 70 inches of Herman’s snow total was accumulated over 7 days ending the morning of March 17. In addition to Herman, Wetmore, and Three Lakes recorded their snowiest week on record after multiple intense storm systems traversed the Great Lakes, dumping 60 to 70 inches of snow across Michigan’s Upper Peninsula. Across Wisconsin, snowfall totaled 6 to 37 inches above normal for March as multiple storms affected the region. Of note, a winter storm and blizzard on March 14-17 brought widespread snowfall totals of 10 to 30 inches across Wisconsin, with locally heavier amounts (Figure 9). In the Tip of the Mitten, Ephraim measured 30 inches of snowfall on March 17 alone, which, if verified, would be a new statewide all-time single-day record. Florence, Wisconsin, reported 29 inches on March 16, which also exceeds the current statewide 24-hour snowfall record. The same powerful winter storm that dropped record snow totals in Wisconsin and Michigan also affected southern Minnesota, with 2-day (March 15-16) totals of 12 to 25 inches. Warmer-than-normal temperatures in late March melted away most of the snowpack in Minnesota and Wisconsin by month’s end, but across Michigan’s Upper Peninsula, snow depth on March 31 remained above normal at 12 to 40 inches.
Drought
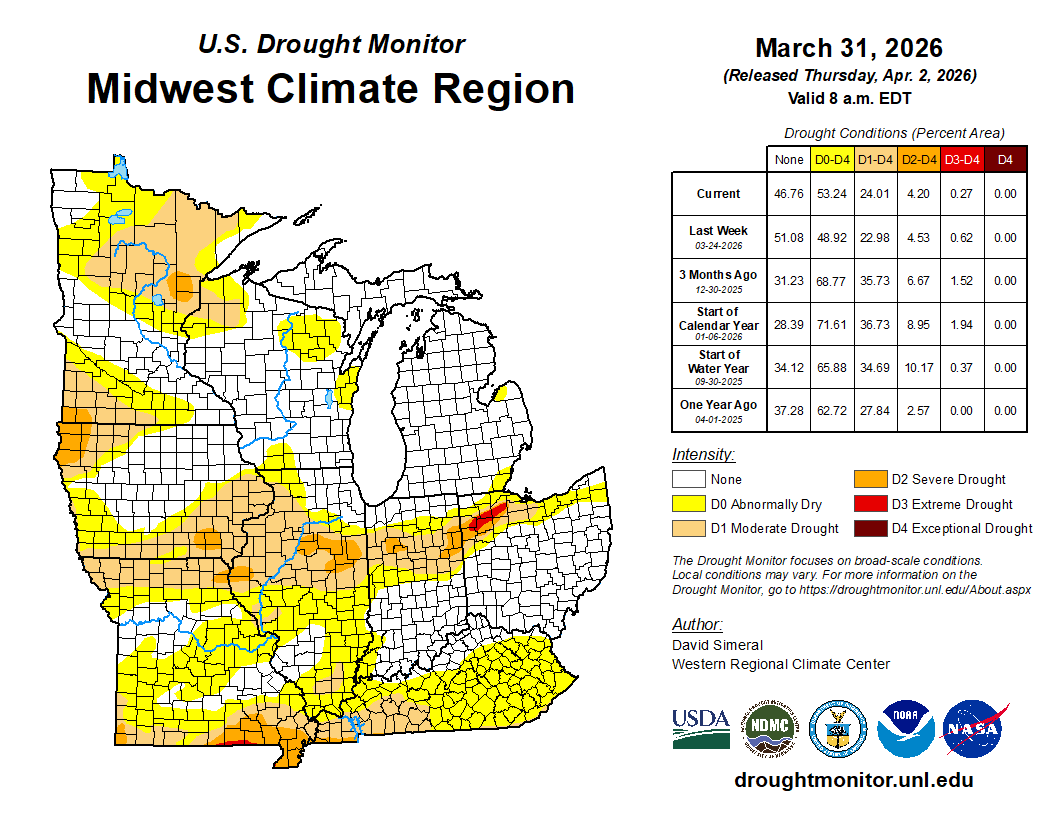
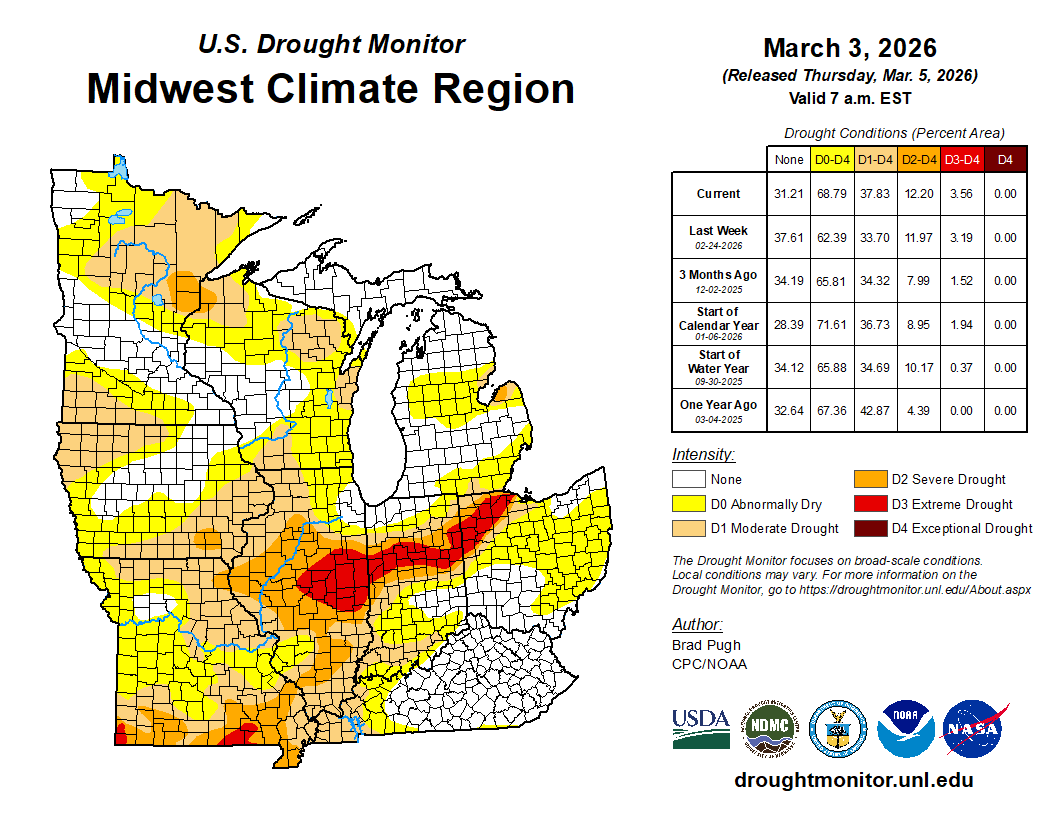
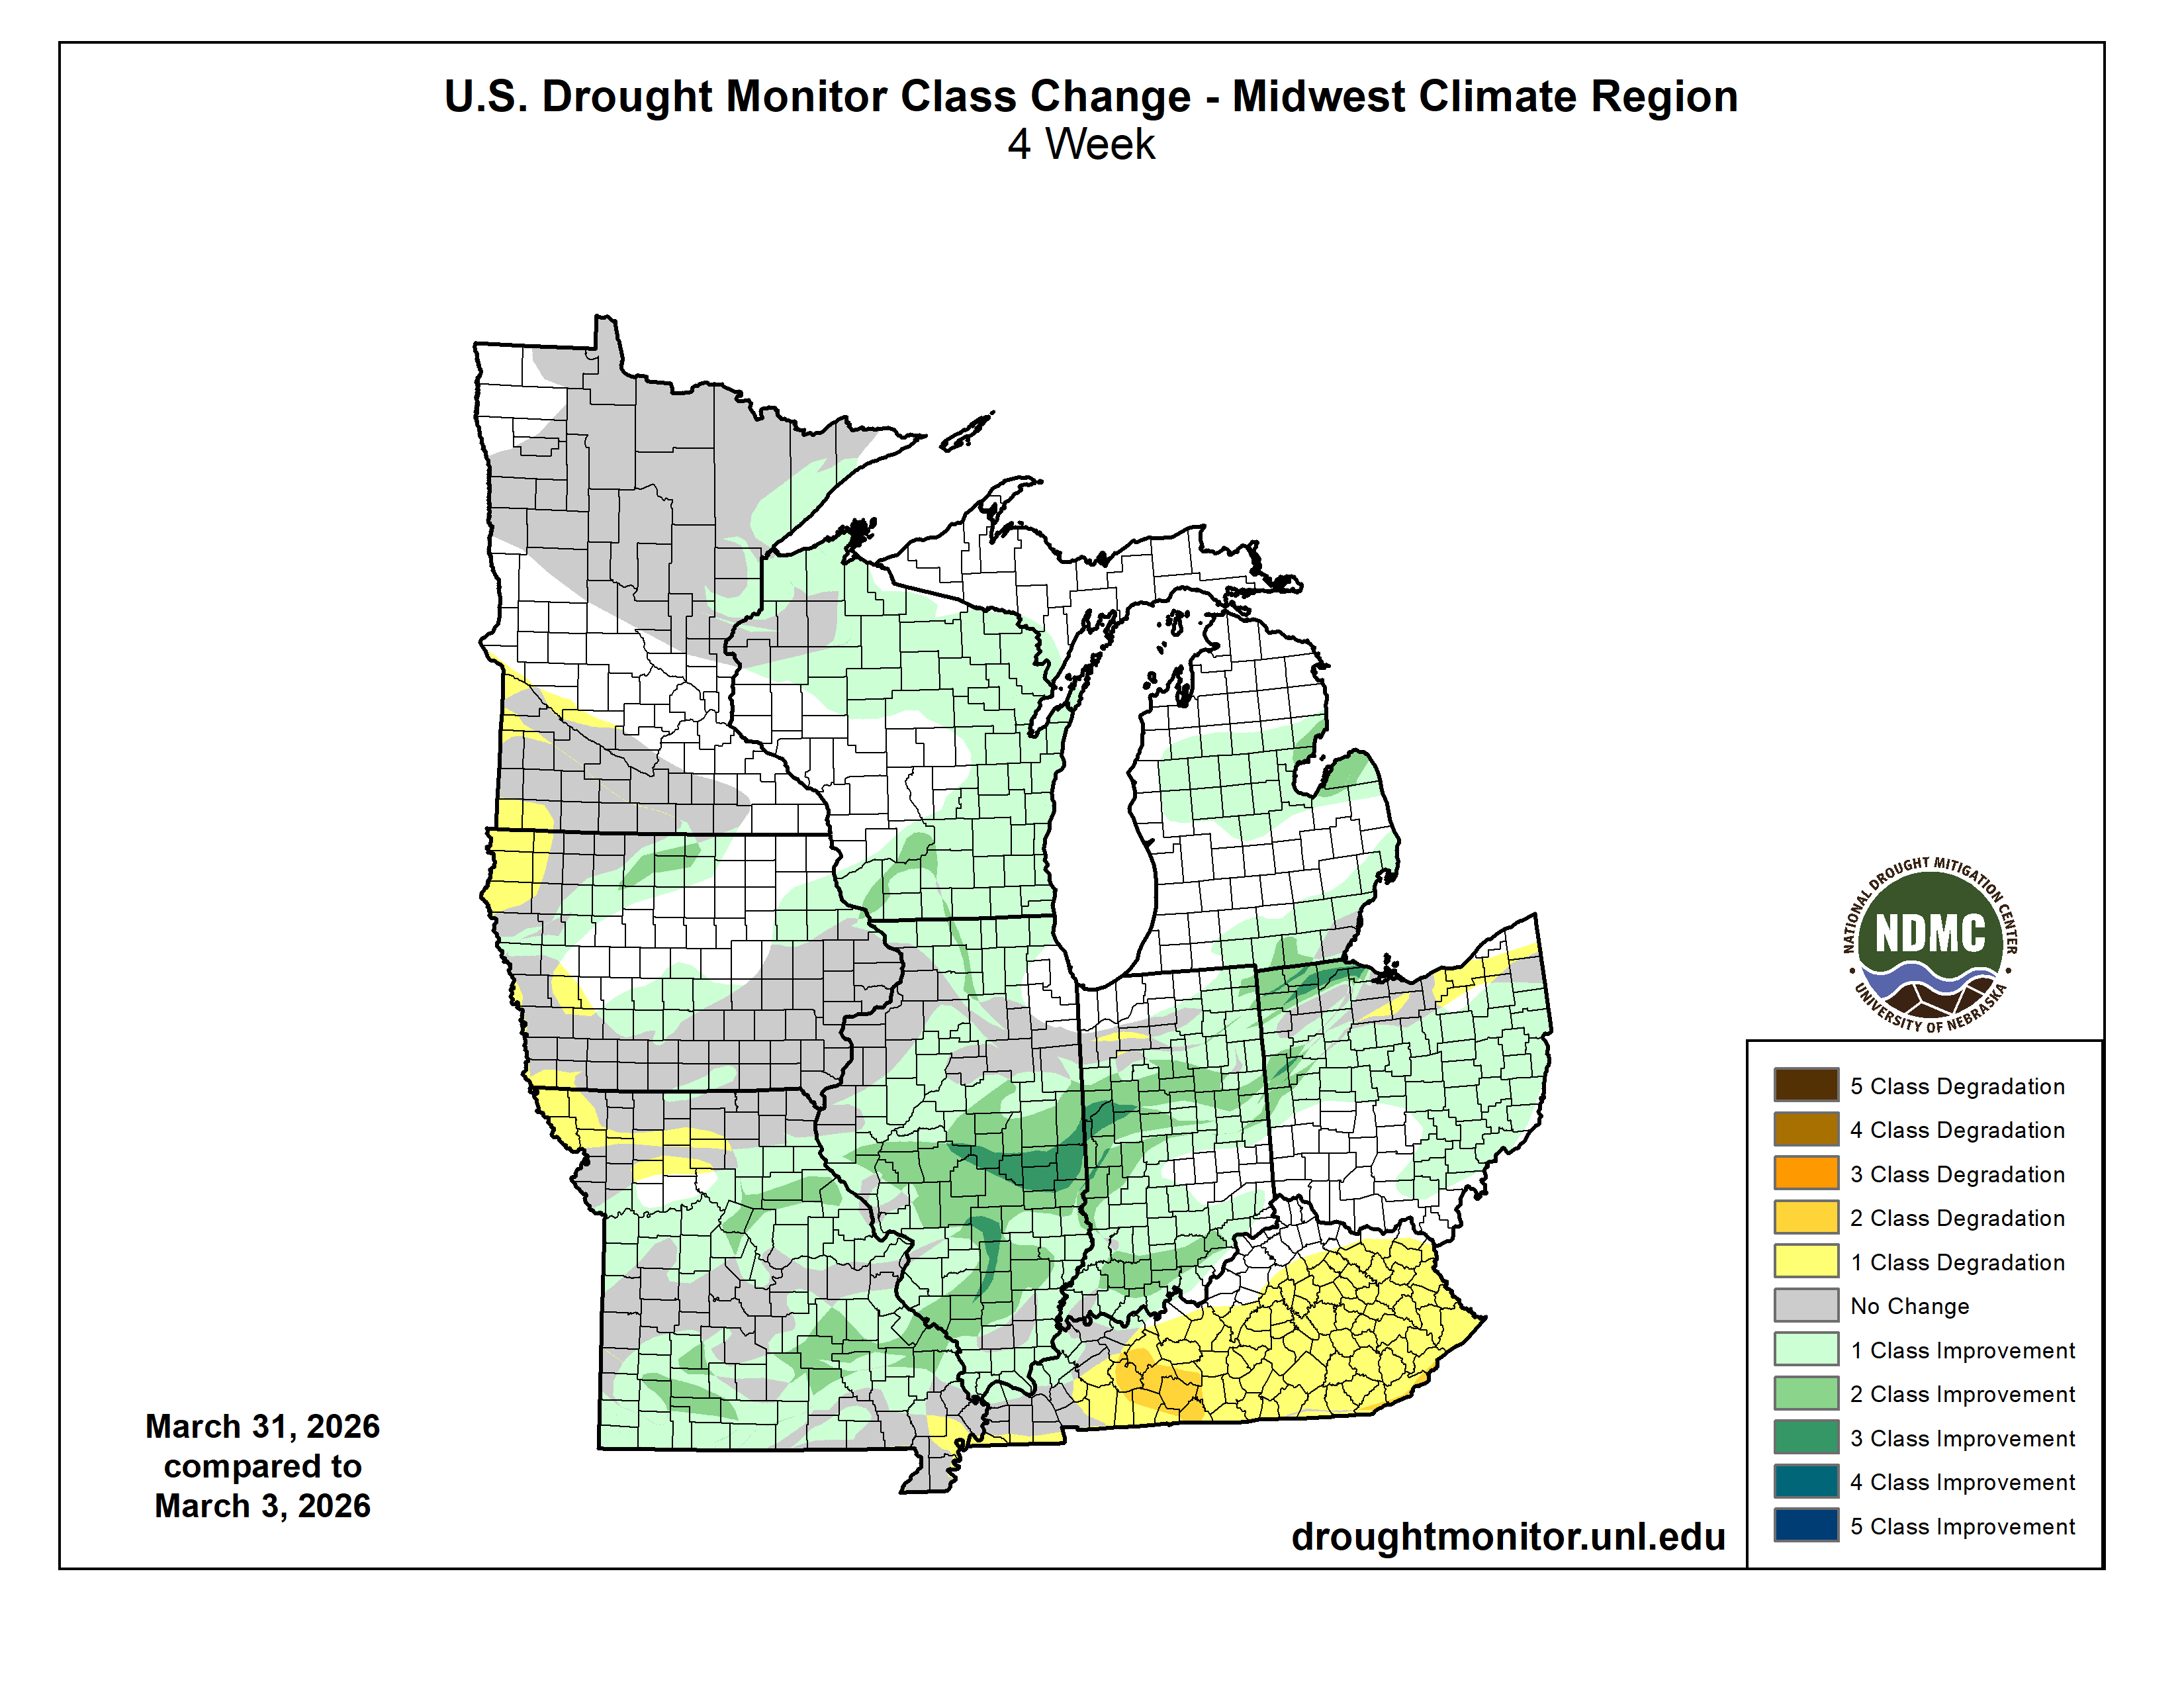
March ended with 53 percent of the Midwest designated as abnormally dry or in drought by the U.S. Drought Monitor (Figure 10), which is about 15 percent less than at the start of the month (Figure 11). The central Midwest had the most notable gains, with 1 to 3 class improvements throughout wide swaths of Missouri, Illinois, Indiana, and Ohio (Figure 12). Nearly all of the Extreme (D3) drought that had plagued the central Midwest since last fall was eliminated, but for a small area in northwest Ohio and southern Missouri. Extremely wet conditions nearly erased all traces of drought or dryness in Michigan and Wisconsin. Conversely, drought expanded in northwest Iowa and western Kentucky, and eastern Kentucky concluded March abnormally dry.
March 6: Deadly Michigan Tornadoes
On March 6, a severe thunderstorm developed in northern Indiana and moved northeast into southern Michigan, where it went on to produce four confirmed tornadoes that resulted in at least 4 fatalities and 22 injuries. The strongest of the tornadoes touched down near Union City, Michigan, and was rated an EF-3 by the National Weather Service with maximum winds reaching 160 mph. Three of the four fatalities occurred with the Union City tornado, making it Michigan’s deadliest March tornado on record.
March 10: Tornado Outbreak and Record Hail
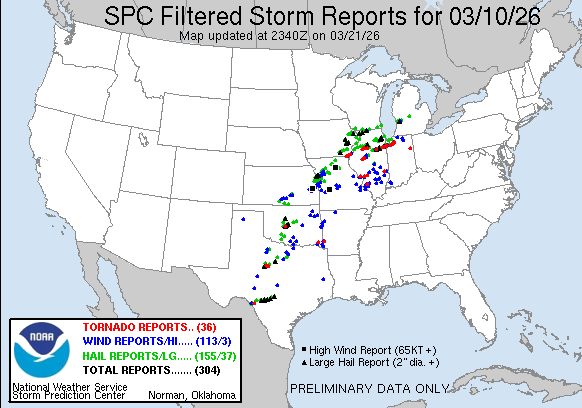
A severe weather outbreak on March 10 produced at least 23 confirmed tornadoes and a wide swath of large hail (2 to 6 inches) across the central Midwest, extending from Kansas City, Missouri, northeastward into western Michigan (Figure 13). The most notable supercell from the event traversed the Kankakee River Valley in northeast Illinois and northwest Indiana. That single storm spawned a family of 12 distinct tornadoes, including the primary tornado, rated an EF-3 (max winds up to 160 mph), which resulted in 3 fatalities. The Kankakee storm also produced hail in excess of 6 inches (15.2 cm) in diameter, which, if confirmed, would become a new statewide record for Illinois.
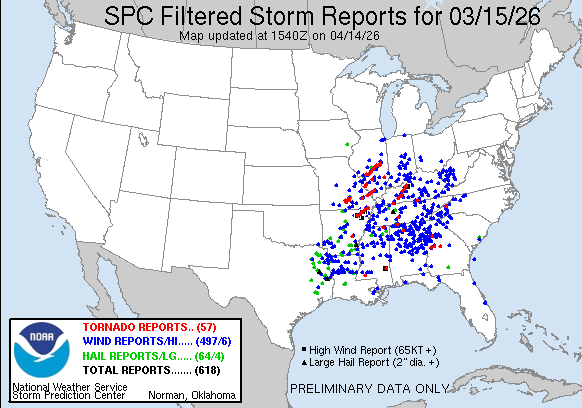
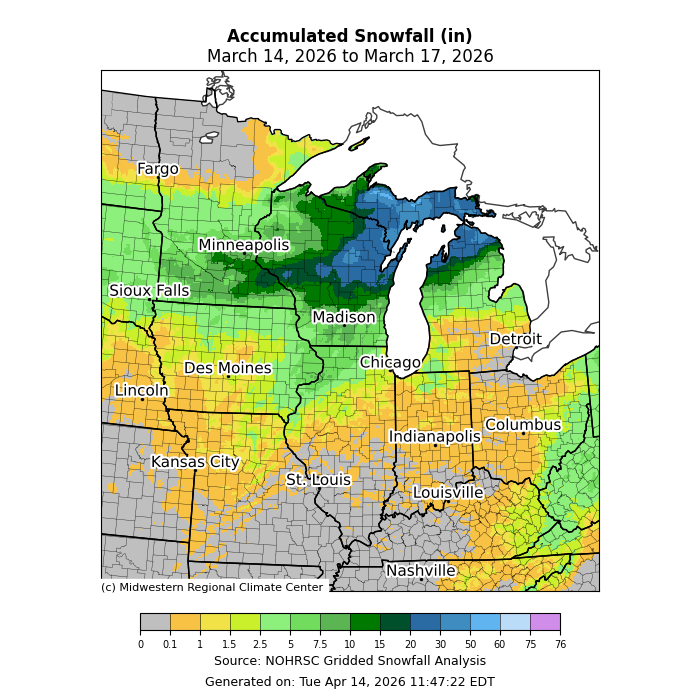
March 14-17, 2026: Severe in the South, Historic Snow in the North
A strong low-pressure system tracked across the Midwest from about March 14-17, bringing tornadoes and high winds to the lower Midwest and a historical snow event to the upper Midwest. In the south, an intense squall line moved from west to east, producing at least 30 confirmed tornadoes along with straight-line winds up to 70 mph on March 15 ahead of a strong cold front (Figure 14). In the upper Midwest, Wisconsin and northern Michigan had snowfall rates up to 4 inches per hour along with thundersnow and winds 40-70 mph, resulting in massive drifting and whiteout conditions on March 15. A second round of snow and blizzard conditions followed on March 16, along with intense lake-effect snow across Michigan’s Upper Peninsula and northern Michigan. Three-day snowfall totals (March 14-17) ranged from 1 to 4 feet across a wide swath of the upper Midwest, with locally heavier amounts (Figure 15).