April 1-7, 2026
Temperatures
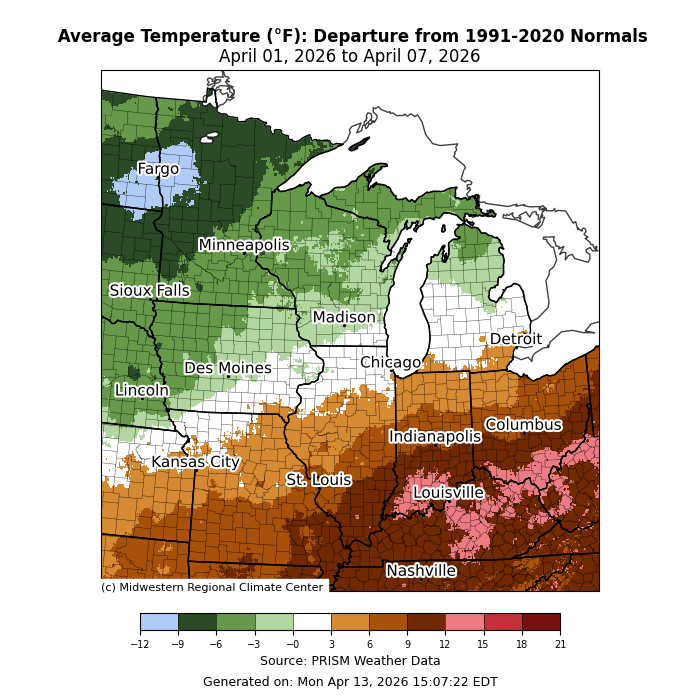
Average temperatures were above normal south of I-80 and near to below normal to the north and west (Figure 1). Across Kentucky, southern Indiana, and southern Ohio, temperatures averaged as much as 12-15°F above normal for the week. Temperatures were generally near normal right along I-80 from Des Moines, Iowa, to Chicago, Illinois. Across parts of Minnesota, temperatures averaged up to 12°F below normal.
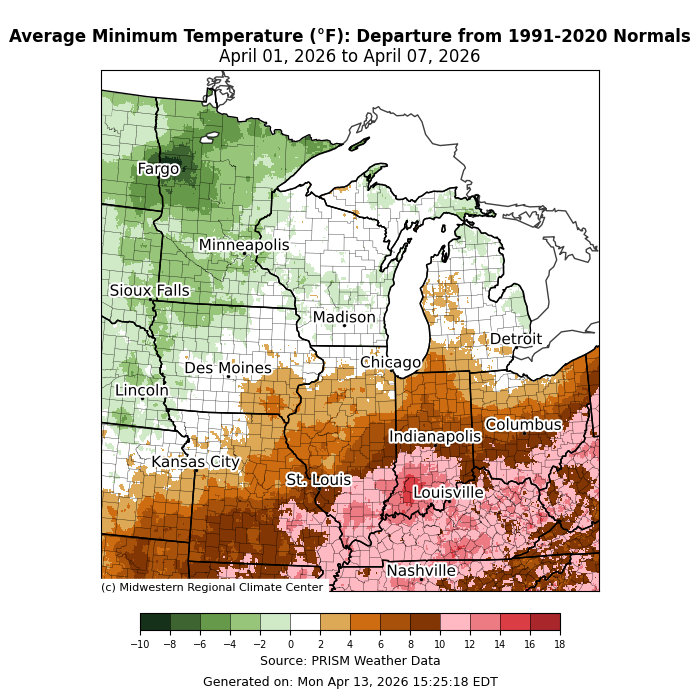
Minimum temperatures averaged above normal to the south and east (Figure 2). Locations along either side of the Ohio River were the most above normal, often by 10-12°F+. Minimum temperatures were near normal for most of the Upper Midwest, save Minnesota, where they averaged below normal by 2-4°F.
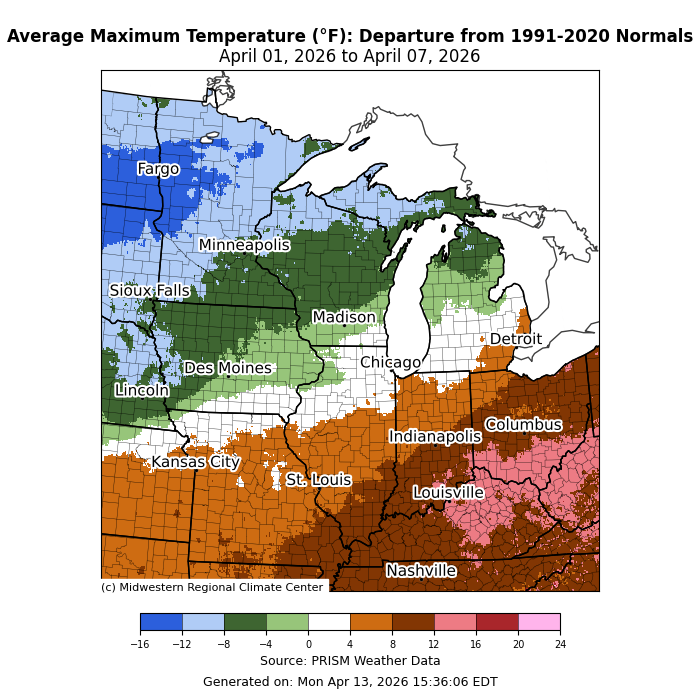
Maximum temperatures were above normal for southern and eastern locations (Figure 3). Parts of Kentucky and Ohio were as much as 12-16°F above normal, while much of the larger Ohio River Basin was 8-12°F above normal. The area around Chicago was near normal, while most places north of I-80 were below normal. The northernmost areas were up to 12°F below normal, and a section of western Minnesota observed average maximum temperatures up to 16°F below normal for the week.
Precipitation/Drought
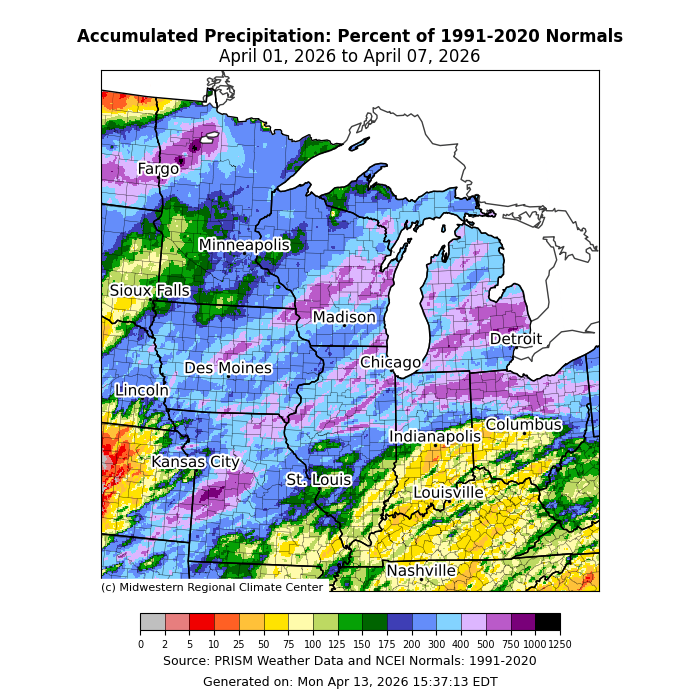
Precipitation was above normal for much of the region, with many areas observing 300-400 percent of normal precipitation (Figure 4). Isolated areas observed precipitation that was over 500 percent of normal for the week. Precipitation was only below normal across the southern halves of both Indiana and Ohio, as well as far southern Illinois, southeastern Missouri, and much of Kentucky. For some locations, this week captured the wettest April days in a decade or more. In Sioux City, Iowa, 1.80 inches of precipitation fell on April 2, making it the wettest April day since 2016. In Green Bay, Wisconsin, 1.61 inches of precipitation fell on April 2, which was the highest single-day total in April since 2011. In Viroqua, Wisconsin, a station with records dating back to 1893 observed 2.24 inches of precipitation, which was the largest single-day total in April there since 2013.
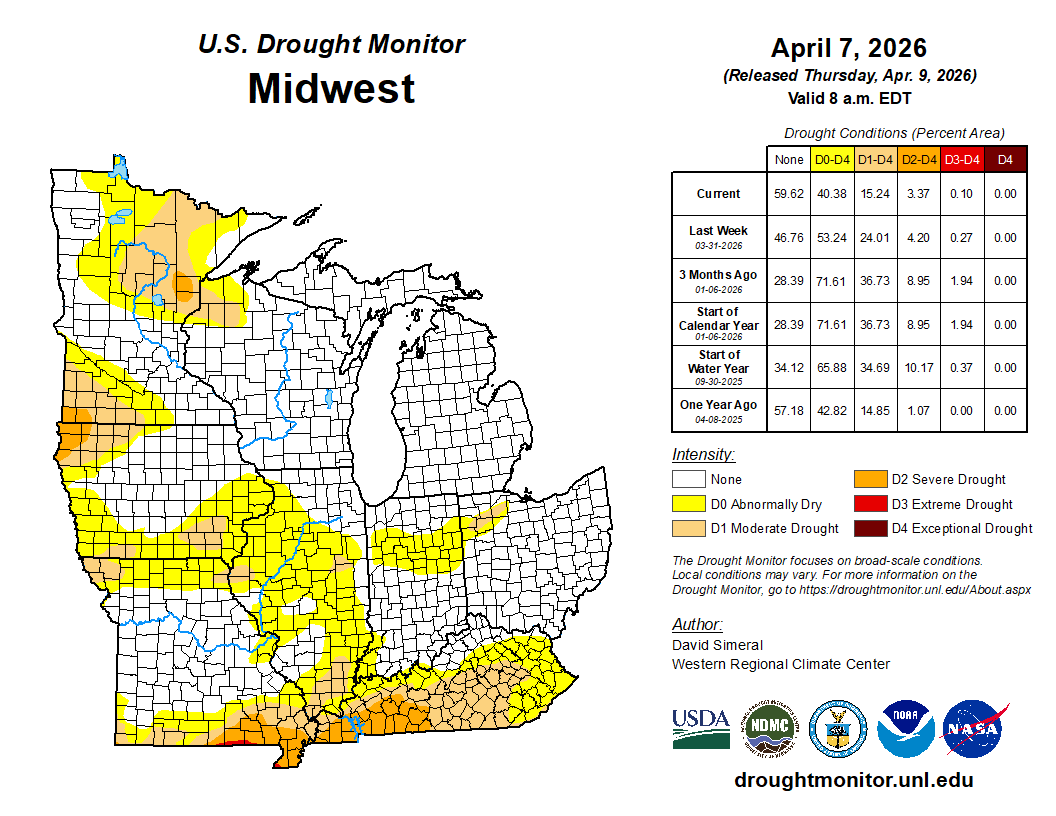
Drought conditions improved across the region from March 31 to April 7. D0 (abnormally dry) now covers less than 50 percent of the region (Figure 5). D1 (moderate drought) decreased from 24 percent coverage to 15 percent coverage, while D2 (severe drought) also saw a slight improvement. Even D3 (extreme drought) was erased completely from northwestern Ohio, leaving a sliver of D3 in southern Missouri.
Severe Weather
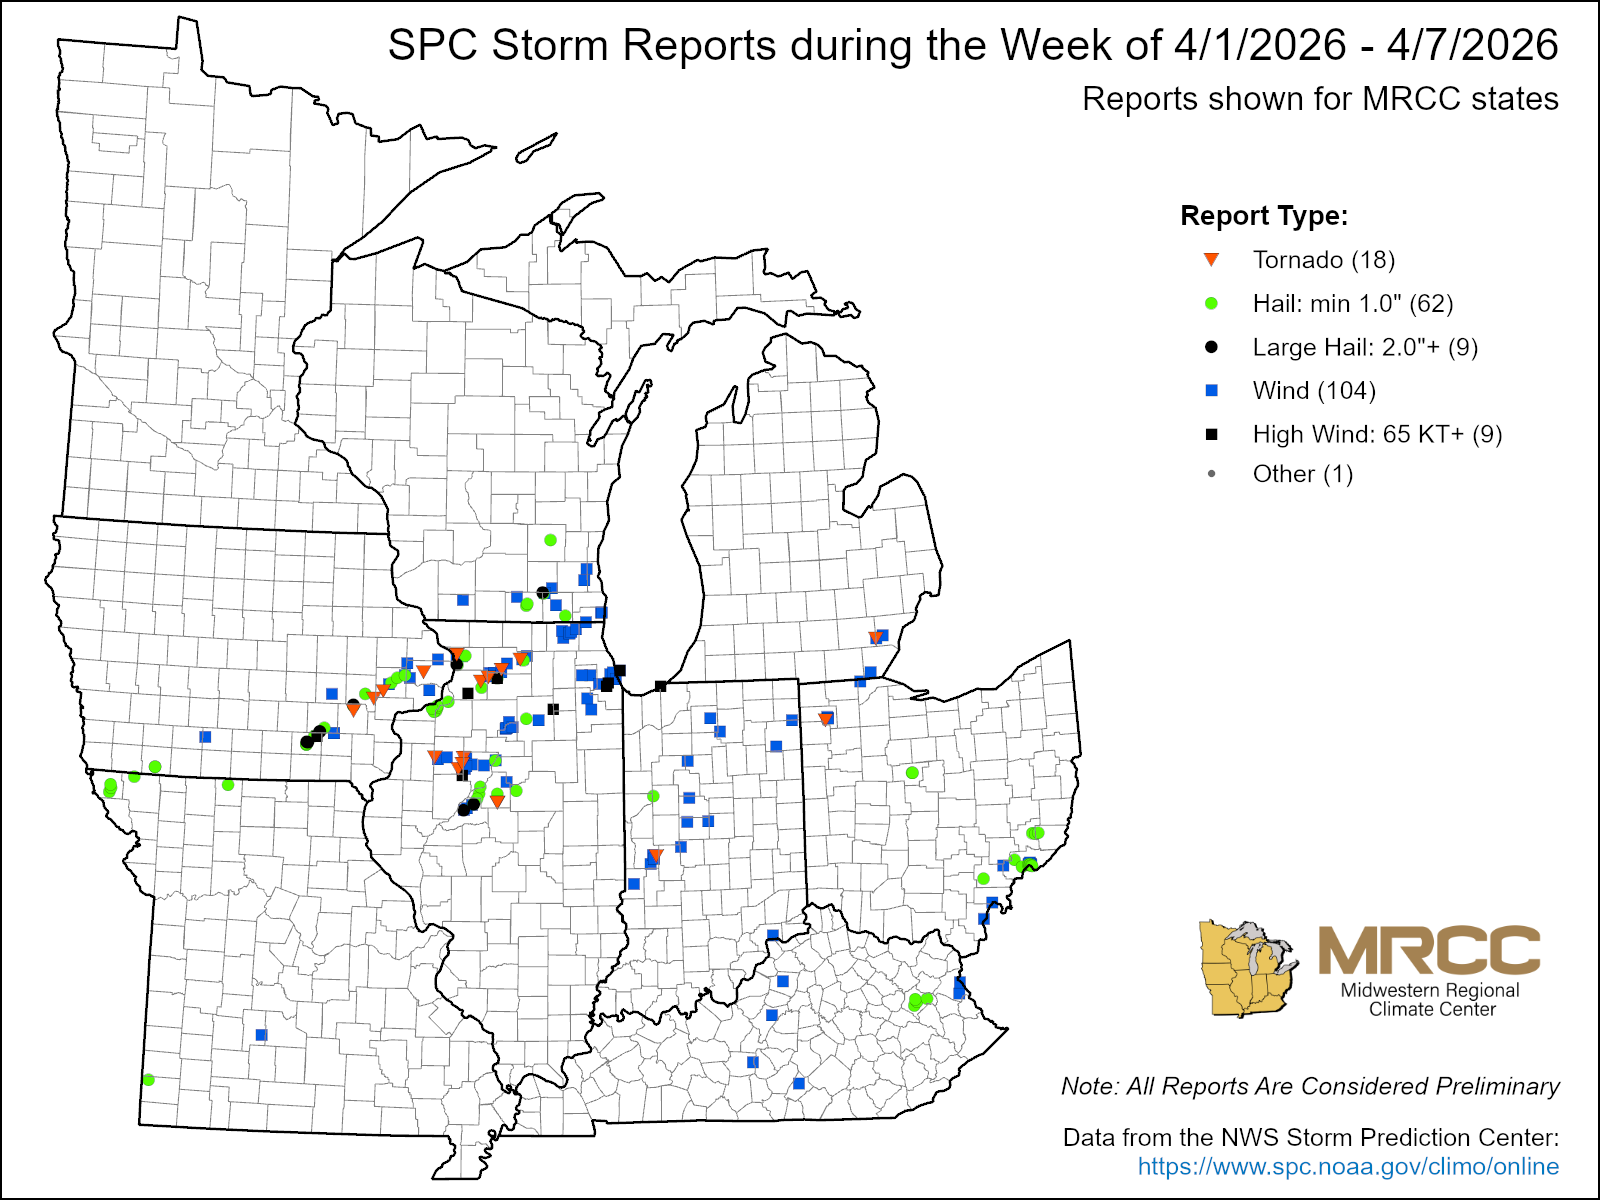
There were just over 200 storm reports this week (Figure 6). While half of those were wind reports, there were 62 reports of hail and 18 reports of a tornado. The largest outbreak came on April 2 and produced both large hail and tornadoes across Illinois and Iowa. 2-inch hail was reported in several spots across eastern Iowa, and damage to two police cars was observed in Washington County. In Carroll County, Illinois, hail rose to over 3 inches.
Five tornadoes were reported across eastern Iowa and western Illinois. Four tornadoes rose to EF1 strength while one was rated an EF0. The longest tornado path was an EF1 that tracked 18.1 miles from Clinton County, Iowa, into Jackson County, Iowa, with estimated peak winds of 105 mph. This tornado snapped several power poles and destroyed over ten outbuildings and sheds. Another EF1 with estimated peak winds of 90 mph tracked 4.1 miles across Sterling, Illinois, and caused a 3000-pound HVAC unit to roll over.